
Generalized DNS Notifications in BIND 9
A new configuration option, notify-cfg CDS, was added to BIND 9 in version 9.
Read postBIND 9.20 is well established and stable. This is a good time to look at the performance of BIND 9.20 vs 9.18 as many users have not yet adopted 9.20. The bottom line is, BIND 9 authoritative server performance is remarkably stable, and authoritative users updating from 9.18 to 9.20 should anticipate a small performance improvement. Some users, with a large number of zones, may see a significant increase in memory usage, however, as explained below. There are a number of other changes to be aware of when moving from BIND 9.18 to 9.20, which are explained in this Knowledgebase article.
As part of the development cycle of BIND 9, we carry out a set of performance tests. Our performance laboratory system for DNS authoritative testing (somewhat unimaginatively called “perflab”) continually cycles through all configurations registered with it, building BIND 9 and running performance tests. (Details of the system have been presented elsewhere, so they will not be described here.) In this way, as the development branches are updated with changes, the effect of those changes on performance is quickly visible. We use a completely different methodology for testing DNS resolver operations, because that is impacted by factors on the live Internet, and tests with canned queries are a poor predictor of real-world performance. Resolver performance results will be presented in a separate blog post.
We have six test profiles:
se-TLD zone. This is a download of the actual .se zone, with all the DNSSEC records stripped out. (It is a copy of the TLD tab from this benchmark from CZ.NIC: https://www.knot-dns.cz/benchmark/).se-TLD-nsec zone, which is the actual .se zone, signed with NSEC (not NSEC3), queried with the names of the zones with a random suffix appended, a bit like a pseudorandom subdomain attack.For each scenario, the query set is one that will result in about 5% NXDOMAIN responses (with the exception of the root zone test, where we would expect a much higher rate of NXDOMAINs).
To obtain a figure for the query rate that BIND can handle, perflab starts up the server under test. It then fires queries at the server for 30 seconds and calculates a query rate. It runs the 30-second measurement 10 times for a single test. The first measurement is discarded from calculations, to allow the server to settle down, i.e., for all data structures to be created and reach their final size. In order to ensure the stability of the results, we repeat this procedure around 50 times. In the table below we report the median across the 50 tests.
We also measure memory usage. For those scenarios where it is relevant, we measured memory usage when the server first starts up, when the glue cache is empty. (This is obviously not representative of a real operational scenario, but a baseline.) The second measurement is actually the maximum memory usage, after the glue cache is presumably fully populated.
se-TLD zone test.The increased memory usage with many small zones is due to changes we made to improve scalability.
Both 9.18 and 9.20 use a per-zone pool of locks to ensure that the server can keep serving a zone while a zone transfer is in progress. For 9.20, we increased the size of the lock pool and introduced a new, higher performance kind of lock. This leads to increased performance across the board, but incurs a fixed memory overhead per-zone. On deployments with a large number of small zones, this overhead adds up. In 9.21, we switched to a global pool of locks, instead of a per-zone one. This will resolve the memory issues for deployments with a large number of zones with the release of our next stable version, BIND 9.22.
The decrease in memory usage in the se-TLD test is due to optimizations done to the glue cache in 9.20.
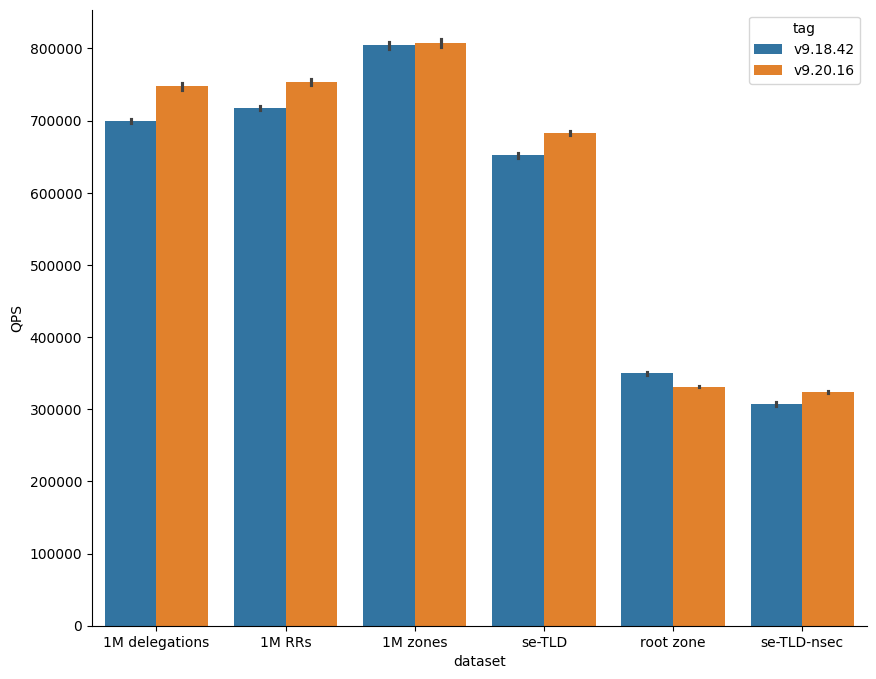
Absolute Performance in Queries Per Second
| dataset | v9.18.42 | v9.20.16 |
|---|---|---|
| 1M RRs | 718,015.55 qps | 755,373.35 qps |
| 1M delegations | 699,260.55 qps | 746,582.25 qps |
| 1M zones | 807,216.10 qps | 811,851.70 qps |
| root zone | 352,215.00 qps | 330,801.10 qps |
| se-TLD | 653,827.20 qps | 684,612.75 qps |
| se-TLD-nsec | 312,074.45 qps | 324,450.55 qps |
Percentage Increase in QPS of 9.20 vs 9.18
| dataset | v9.18.42 | v9.20.16 |
|---|---|---|
| 1M RRs | 0.00 % | 5.20 % |
| 1M delegations | 0.00 % | 6.77 % |
| 1M zones | 0.00 % | 0.57 % |
| root zone | 0.00 % | -6.08 % |
| se-TLD | 0.00 % | 4.71 % |
| se-TLD-nsec | 0.00 % | 3.97 % |
Absolute Memory Usage
| dataset | glue_cache | v9.18.42 | v9.20.16 |
|---|---|---|---|
| 1M RRs | x | 645.50 MB | 630.40 MB |
| 1M delegations | empty | 489.65 MB | 476.80 MB |
| 1M delegations | full | 552.45 MB | 554.70 MB |
| 1M zones | x | 9503.35 MB | 12180.50 MB |
| se-TLD | empty | 795.70 MB | 823.00 MB |
| se-TLD | full | 2443.70 MB | 1571.30 MB |
| se-TLD-nsec | x | 1820.15 MB | 1910.20 MB |
Percentage Increase in Memory Used in 9.20 vs 9.18
| dataset | glue_cache | v9.18.42 | v9.20.16 |
|---|---|---|---|
| 1M RRs | x | 0.00 % | -2.34 % |
| 1M delegations | empty | 0.00 % | -2.62 % |
| 1M delegations | full | 0.00 % | 0.41 % |
| 1M zones | x | 0.00 % | 28.17 % |
| se-TLD | empty | 0.00 % | 3.43 % |
| se-TLD | full | 0.00 % | -35.70 % |
| se-TLD-nsec | x | 0.00 % | 4.95 % |
We hope that this information helps alleviate concerns about a performance regression from the list of considerations when planning an update to BIND 9.20.
What's New from ISC

A new configuration option, notify-cfg CDS, was added to BIND 9 in version 9.
Read post
In this post, we will show that BIND 9.20 compares favorably with 9.
Read post